A HTTP Archive (HAR) trace can be used to view any Http\Https web requests and responses made from your web browser. HAR traces are useful when you do not want to install a full application like Fiddler, as HAR files can be captured naively using most Web Browsers like Edge, Chrome, or Internet Explorer. Capturing this data can be very useful for analyzing errors encountered. To capture a HAR trace, follow the steps below
To generate the HAR file for Internet Explorer
- Open Internet Explorer and go to the page where the issue is occurring.
- Press F12 on your keyboard(or click the gear icon > F12 Developer Tools)
- Click the Network tab.
- Reproduce the issue that you were experiencing before, while the network requests are being recorded.
- Once done click the Save button to export as HAR (or press Ctrl+S).

- Give the trace a filename and click the Save button which will save it as a .har file .
- Upload your HAR file to your ticket or attach it to your email so that we may analyze it.
To generate the HAR file for Chrome
- Open Google Chrome and go to the page where the issue is occurring.
- From the Chrome menu bar select View > Developer > Developer Tools .
- From the panel opened at the bottom of your screen, select the Network tab.
- Look for a round red Record button ( )) in the upper left corner of the Network tab, and make sure it is red. If it is grey, click it once to start recording.
- Check the box next to Preserve log .
- Click the Clear button ( )) to clear out any existing logs from the Network tab.
- Now try to reproduce the issue that you were experiencing before, while the network requests are being recorded.
- Once you have reproduced the issue, right click anywhere on the grid of network requests, select Save as HAR with Content , and save the file to your computer.

- Upload your HAR file to your ticket or attach it to your email so that we may analyze it.
To generate the HAR file for Edge
- Browse to the URL where you are seeing the issue.
- Navigate to Developer tools (use F12 as a shortcut) and select the “Network” tab.
- Refresh the page to start capturing the traffic between the browser to the server, or click on a link with which you are seeing the issue. The aim is to reproduce the issue and capture the output.
- Click on “Export as HAR” followed by Save As… to save the HAR file.

HAR trace Analysis with Fiddler
A support technician can then analyze this HAR trace using an application like Fiddler.
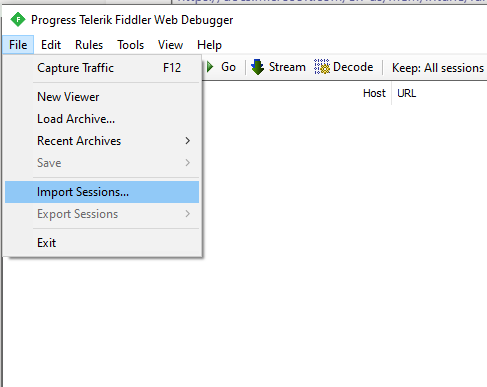
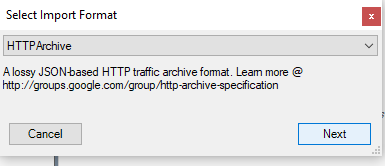
The steps for that are using the File -> Import Sessions option in Fiddler and then choosing HTTPArchive as shown below.