A Fiddler trace can be used to view any Http\Https web requests and responses made from your web browser. Capturing this data can be very useful for analyzing errors encountered. To capture a Fiddler trace, follow the steps below.
How to capture a Fiddler trace
- Download Fiddler from here and install it.
- Run Fiddler and go to Tools -> Fiddler Options.
- On the HTTPS page, verify that Capture HTTPS Connects is enabled.
- Verify that Decrypt HTTPS traffic is enabled with the …from all processes option.
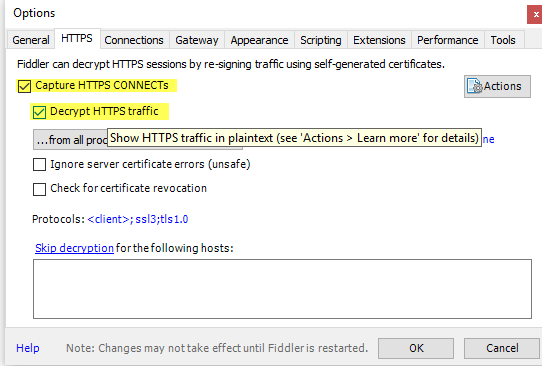
- NOTE: If you are in a Federated enviornment, please also check Rules -> Automatically Authenticate.
- In the very bottom left of the Fiddler application, ensure that you see “Capturing” displayed indicating that Fiddler is capturing traffic.
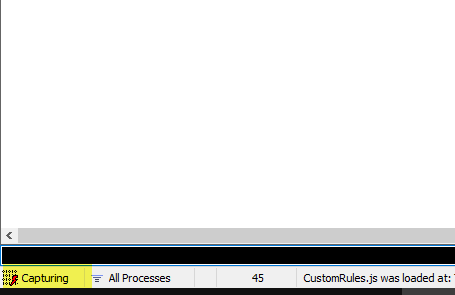
- If Fiddler is not capturing. Choose File -> Capture Traffic (Or press F12)
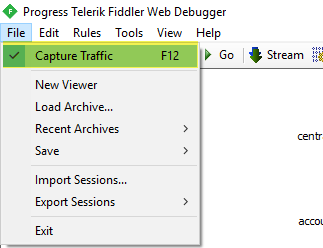
- Minimize Fiddler to tray.
- Replicate the reported issue.
- Once Complete, you can stop capturing by selecting File -> Capture Traffic again or pressing F12
- In Fiddler, go to File -> Save -> All Sessions and save the archive to disk.
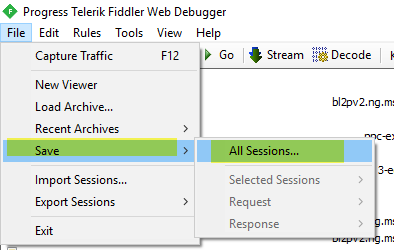
- Save .SAZ file locally and then provide this .SAZ to engineer troubleshooting your issue
- Once complete, Fiddler can be uninstalled from Windows Control Panel \ Programs and Features \ Uninstall “Progress Telerik Fiddler”